Erik Wolf · 6 September 2026
Seasonal Fluctuations and Their Effects on Long Term Platform Metrics
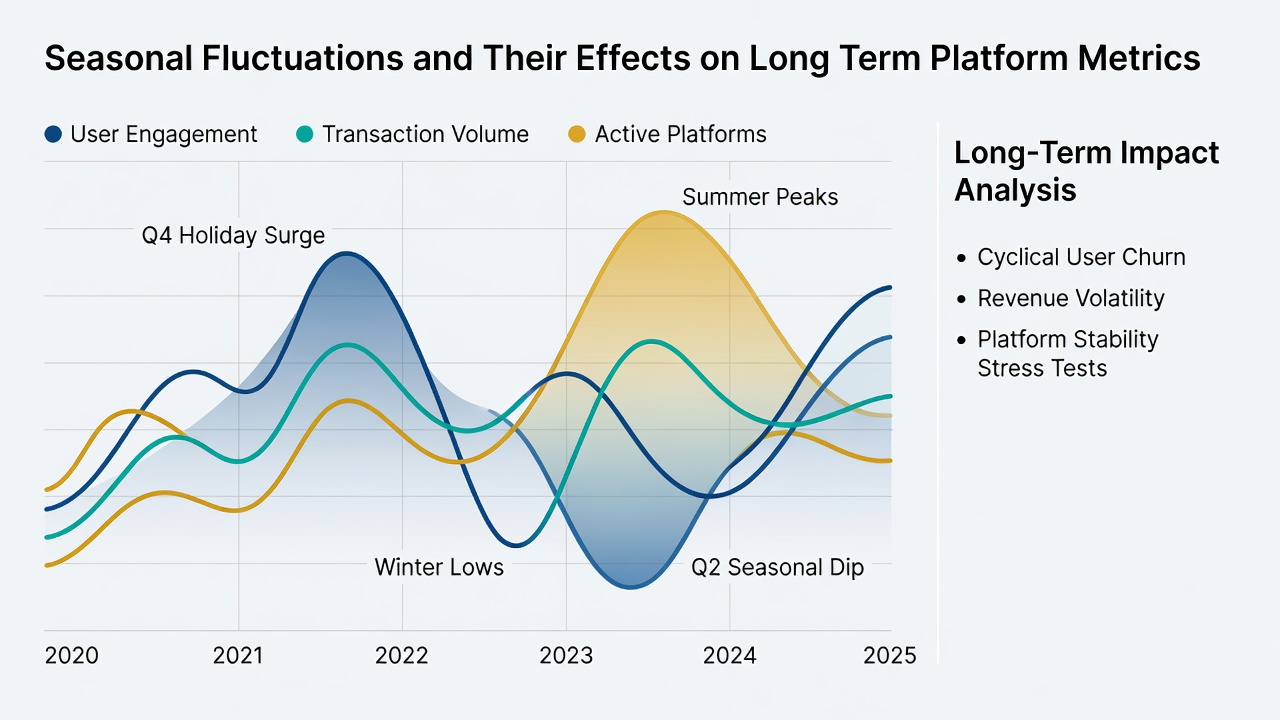
Seasonal fluctuations influence platform metrics in measurable ways that extend across user activity, engagement rates, and revenue streams, and analysts track these patterns through consistent data collection methods that span multiple years. Data compiled through September 2026 shows recurring cycles tied to holidays, academic calendars, and weather changes that alter how people interact with online services, while long-term metrics require adjustments to separate temporary shifts from underlying growth trends. Researchers at institutions such as the University of California have documented how these variations appear in sectors ranging from e-commerce sites to subscription-based applications, where winter months often bring higher session durations on entertainment platforms compared with summer periods when outdoor activities compete for attention.
Patterns in User Engagement Across Calendar Cycles
Platform operators observe distinct peaks during specific quarters, with the fourth quarter frequently recording elevated login frequencies on social and retail applications because of holiday promotions and gift-buying behaviors, whereas the third quarter tends to show dips as vacations reduce daily screen time. According to figures from the US Census Bureau on retail e-commerce, online sales exhibit consistent quarterly swings that align with consumer spending habits, and similar rhythms appear in non-retail platforms where content consumption follows school schedules and professional deadlines. Those who manage SaaS tools report that productivity applications experience steadier usage during January through March as organizations set annual targets, yet metrics for collaboration features may decline in August when many teams operate with reduced staffing.
Revenue and Retention Metrics Over Multiple Years
Long-term revenue projections incorporate seasonal multipliers because raw monthly figures can mislead observers about overall trajectory, and companies adjust forecasts by applying historical indices derived from prior cycles. Studies published by Eurostat on digital service usage reveal that subscription renewals cluster around January and September, creating predictable cash flow variations that affect annual reporting, while churn rates rise in February and June when users reassess commitments after peak periods. Observers note that platforms serving educational content see enrollment surges in late summer that sustain through the academic year, and these patterns compound over time to influence customer lifetime value calculations when analysts apply smoothing techniques to remove seasonal noise.
Geographic and Demographic Variations in Seasonal Impact
Regional differences emerge because climate and cultural events diverge across markets, so platforms operating globally apply localized models rather than uniform corrections. Data from Statistics Canada indicates that northern markets experience sharper winter spikes in indoor digital activity compared with southern regions where milder conditions extend outdoor alternatives, and these contrasts require segmented reporting to avoid averaging out meaningful local signals. Demographic groups further complicate the picture, with younger users showing stronger responses to back-to-school promotions in August and September while older cohorts maintain steadier engagement throughout the year, according to research compiled by the Australian Bureau of Statistics on household internet usage patterns.
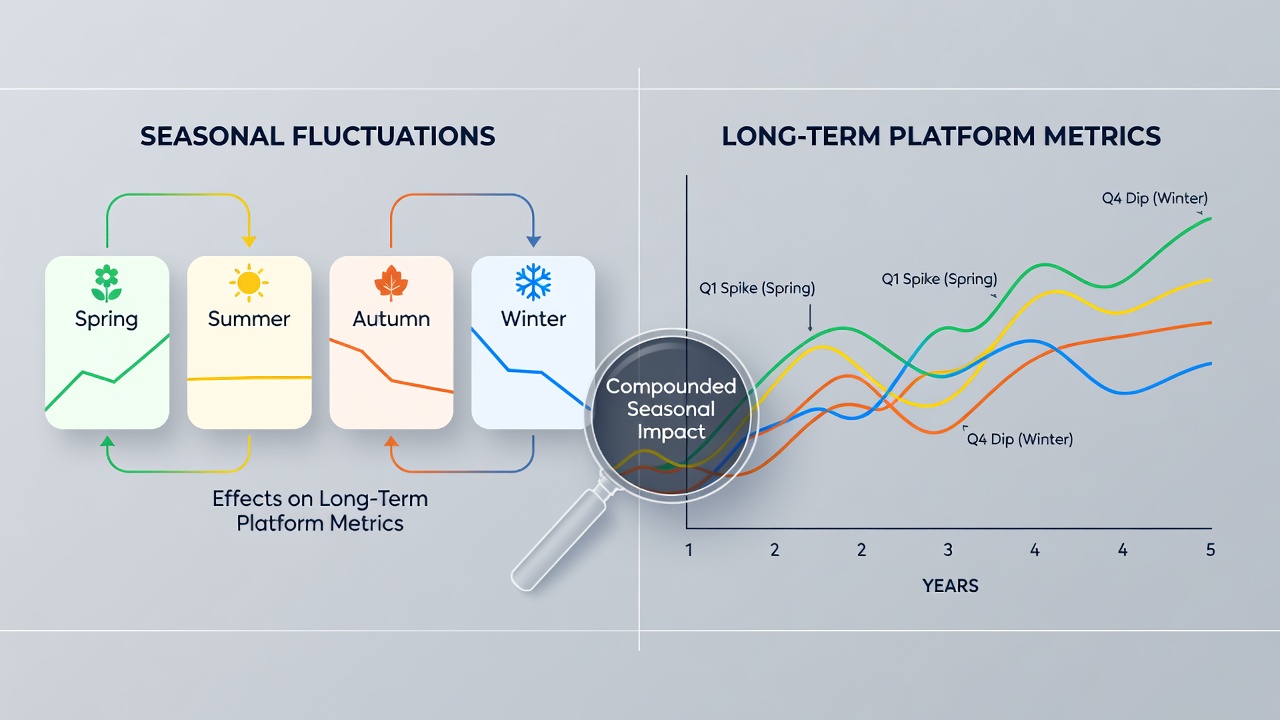
Platform teams apply cohort analysis to isolate seasonal effects from genuine retention changes, and this approach reveals whether a drop in active users during July represents a temporary lull or the start of a broader decline. Evidence from multiple industry reports demonstrates that unadjusted metrics can distort year-over-year comparisons, leading operators to adopt rolling averages and deseasonalized indices that present clearer pictures of underlying performance.
Adjustments and Forecasting Methods
Analysts employ statistical techniques such as X-13ARIMA-SEATS to remove seasonal components from time series data, allowing organizations to evaluate true growth rates without the overlay of predictable calendar effects. These methods, referenced in documentation from the US Bureau of Labor Statistics on employment and productivity indicators, help platform managers set realistic targets and allocate resources during expected low periods rather than reacting to normal fluctuations. Companies that integrate external signals like weather forecasts or school calendars into their models achieve tighter alignment between projected and actual metrics, particularly when planning infrastructure scaling for anticipated traffic surges around major shopping events.
Cross-platform comparisons highlight that metrics tied to advertising inventory follow different seasonal curves than those tied to subscription revenue, and successful operators maintain separate tracking systems for each category to avoid conflating unrelated patterns. Through September 2026, datasets from platforms across North America and Europe continue to confirm that holiday-driven quarters produce outsized contributions to annual totals, yet the magnitude of these contributions has remained relatively stable over the preceding five-year window.
Conclusion
Seasonal fluctuations represent a structural feature of platform metrics that persists across diverse service categories and geographic markets, and organizations that apply consistent adjustment procedures obtain more reliable views of long-term performance. Continued monitoring through established statistical frameworks ensures that temporary calendar effects do not obscure genuine shifts in user behavior or revenue potential, supporting informed decisions about product development and capacity planning.